Recently I was going through the works of Swami Vivekanda..and these are some of the excerpts from the book.
Work and it’s secret – Delivered at Los Angeles, California, January 4th 1900
“One of the greatest lessons I have learnt in my life is to pay as much attention to the means of work as to it’s end. It appears to me that all the secret of success is there; to pay as much attention to the means as to the end. Our greatest defect in life is that we are drawn so much to the ideal, the goal is so much more enchanting, so much more alluring, so much bigger in our mental horizon, that we loose sight of the details altogether.
But whenever failure comes, if anayze it critically, in ninety nine percent of the cases, we shall find that it was because we did not pay attention to the means. With the means all right, the end must come.”
In 1943 Karou Ishikava coined the cause and effect diagram.

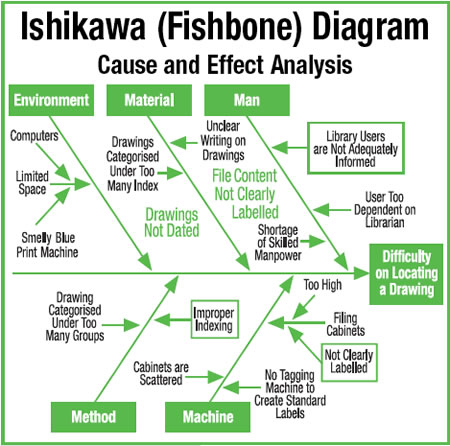
Dr. Kaoru Ishikawa, a Japanese quality control statistician, invented the fishbone diagram. It is often also referred to as the Ishikawa diagram. The fishbone diagram is an analysis tool that provides a systematic way of looking at effects and the causes that create or contribute to those effects. Because of the function of the fishbone diagram, it may be referred to as a cause-and-effect diagram. The design of the diagram looks much like the skeleton of a fish. Therefore, it is often referred to as the fishbone diagram. A cause-and-effect diagram can help identify the reasons why a process goes out of control. Often the fishbone diagram can be used to summarize the results of a brainstorming session, identifying the causes of a specified undesirable outcome. It helps to identify root causes and ensures a common understanding of the causes.
Cause-and-effect relationships govern everything that happens and as such are the path to effective problem solving. By knowing the causes, we can find some that are within our control and then change or modify them to meet our goals and objectives. By understanding the nature of the cause-and-effect principle, we can draw a diagram to help us solve everyday problems every time. Below is an example of use of Ishikawa Diagram to solve a difficulty on locating a drawing.
A Japanese building further on Indian’s idea!
Root causes for failure of Root cause analysis using Ishikawa Diagram
- The number one root cause for failure of the application if Ishikawa diagrams in identifying the root causes is not drilling down further till one reaches the real root causes. Instead we end up treating the symptoms. The 5 Why technique will help to hit the real root causes.
- Whenever there is a burning problem, the first priority is to fix the problem. Very often after the fix, the problem is forgotten, till it re-surfaces afterwards.
- Sometimes, the real root causes are very unpleasant. Hence, to be politically right, people play it safe.
Ishikawa giagrams are also known as Fish bone diagrams and Cause and effect diagrams. Generally Ishikawa diagrams are used to analyse past outcomes (effect). I have used it as a great planning tool by reverse engineering the Ishikawa diagram where the focus is on the desired outcomes and the parameters that need to be controlled to achieve the desired results.